GAMCO Investors, Inc. Reports Excellent Results for the Second Quarter 2025
- Quarter End AUM of $33.4 billion
- Operating Margin of 32.5%
- Second Quarter EPS of $0.93 versus $0.61 in the Second Quarter of 2024
- $183 million in Cash, Cash Equivalents, Seed Capital, and Investments, and No Debt
-
Partnership with Keeley added 4 Open-End Funds and ~500 SMAs with approximately $1.0 billion in AUM on May 1st
GREENWICH, Conn., Aug. 05, 2025 (GLOBE NEWSWIRE) -- GAMCO Investors, Inc. (“Gabelli”) (OTCQX: GAMI) today reported its operating results for the quarter ended June 30, 2025.
Financial Highlights
| (In thousands, except percentages and per share data) | ||||||||||||
| Three Months Ended | ||||||||||||
| June 30, 2025 | March 31, 2025 | June 30, 2024 | ||||||||||
| U.S. GAAP | ||||||||||||
| Revenue | $ | 59,024 | $ | 57,328 | $ | 57,644 | ||||||
| Expenses | 39,854 | 38,735 | 41,994 | |||||||||
| Operating income | 19,170 | 18,593 | 15,650 | |||||||||
| Non-operating income | 5,872 | 1,220 | 2,535 | |||||||||
| Net income | 20,831 | 18,271 | 15,017 | |||||||||
| Diluted earnings per share | $ | 0.93 | $ | 0.81 | $ | 0.61 | ||||||
| Operating margin | 32.5 | % | 32.4 | % | 27.1 | % | ||||||
Giving Back to Society - $80 million since IPO
Since our initial public offering in February 1999, our firm’s combined charitable donations total approximately $80 million, including $48 million through the shareholder designated charitable contribution program. Based on the program created by Warren Buffett at Berkshire Hathaway, our corporate charitable giving is unique in that the recipients of Gabelli’s charitable contributions are chosen directly by our shareholders, rather than by our corporate officers. Since its inception in 2013, Gabelli shareholders have designated charitable gifts to approximately 350 charitable organizations.
The charitable giving program continues today with the creation of a private foundation, the Gabelli Funds Foundation, in September 2024. Headquartered in our office in Reno, Nevada, the charitable program was seeded with an initial contribution of $5 million.
Revenue
| (In thousands) | Three Months Ended | |||||||
| June 30, 2025 | June 30, 2024 | |||||||
| Investment advisory and incentive fees | ||||||||
| Funds | $ | 38,989 | $ | 37,909 | ||||
| Institutional and Private Wealth Management | 15,139 | 15,377 | ||||||
| SICAV | 4 | 4 | ||||||
| Performance-based | 1,313 | - | ||||||
| Total | $ | 55,445 | $ | 53,290 | ||||
| Distribution fees and other income | 3,579 | 4,354 | ||||||
| Total revenue | $ | 59,024 | $ | 57,644 | ||||
The year over year increase in Funds revenues was primarily the result of higher average assets under management. The Institutional and Private Wealth Management slippage in revenues was the result of lower equity assets at the beginning of the quarter, which are generally used to calculate the revenues. The decrease in distribution fees and other income was primarily the result of a decrease in equity mutual funds AUM that pay distribution fees.
Expenses
| (In thousands) | Three Months Ended | |||||||
| June 30, 2025 | June 30, 2024 | |||||||
| Compensation | $ | 25,035 | $ | 29,006 | ||||
| Management fee | 2,785 | 2,021 | ||||||
| Distribution costs | 5,319 | 5,709 | ||||||
| Other operating expenses | 6,715 | 5,258 | ||||||
| Total expenses | $ | 39,854 | $ | 41,994 | ||||
The lower compensation expense in the second quarter of 2025 when compared to the prior year quarter reflects $5.4 million of waived compensation partially offset by higher fixed compensation of $0.6 million and higher variable compensation of $0.8 million.
Operating Margin
The operating margin, which represents the ratio of operating income to revenue, was 32.5% for the second quarter of 2025 compared with 27.1% for the second quarter of 2024.
Non-Operating Income
| (In thousands) | Three Months Ended | |||||||
| June 30, 2025 | June 30, 2024 | |||||||
| Gain/(loss) from investments, net | $ | 4,567 | $ | 99 | ||||
| Interest and dividend income | 1,615 | 2,726 | ||||||
| Interest expense (a) | (310 | ) | (290 | ) | ||||
| Total non-operating income | $ | 5,872 | $ | 2,535 | ||||
| (a) Related to GAAP accounting of finance lease. | ||||||||
Non-operating income increased $3.3 million for the quarter, reflecting the mark-to-market quarterly gain on our investment portfolio slightly offset by a decrease in interest and dividend income.
Other Financial Highlights
The effective income tax rate for the second quarter of 2025 was 16.8% versus 17.4% for the second quarter of 2024.
Cash, cash equivalents, seed capital, and investments were $182.8 million with no debt at June 30, 2025.
Growth Initiatives: Lift-outs, Partnerships, Joint Ventures, New Markets
|
- |
Partnership with Keeley management will enhance our research and portfolio teams for small and mid-cap focused assets |
||
| On May 1, 2025, Gabelli formalized our partnership with Keeley for the management contracts of 4 open-end funds and approximately 500 separately managed accounts. This transaction with Teton Advisors, LLC added close to $1.0 billion of AUM. The current Chicago-based Keeley research, portfolio management, and client service teammates have joined Gabelli and will continue to manage and service these assets. Our history with the Keeley founder, John L. Keeley, Jr., dates back to the mid-1960’s, prior to the formation of your company, when John L. Keeley, Jr. and our Executive Chairman were sell side analysts. Our firms are privileged to continue our shared focus on a client first culture steeped in research. | |||
Assets Under Management
| (In millions) | As of | |||||||||||
| June 30, 2025 | March 31, 2025 | June 30, 2024 | ||||||||||
| Mutual Funds | $ | 8,817 | $ | 7,959 | $ | 8,035 | ||||||
| Closed-end Funds | 7,627 | 7,365 | 7,052 | |||||||||
| Institutional & PWM (a) (b) | 11,374 | 10,182 | 10,436 | |||||||||
| SICAV | 9 | 9 | 9 | |||||||||
| Total Equities | 27,827 | 25,515 | 25,532 | |||||||||
| 100% U.S. Treasury Money Market Fund | 5,498 | 5,638 | 5,159 | |||||||||
| Institutional & PWM Fixed Income | 32 | 32 | 32 | |||||||||
| Total Treasuries & Fixed Income | 5,530 | 5,670 | 5,191 | |||||||||
| Total Assets Under Management | $ | 33,357 | $ | 31,185 | $ | 30,723 | ||||||
| (a) Includes $211, $206, and $297 of AUM subadvised for Teton Advisors, Inc. at June 30, 2025, | ||||||||||||
| March 31, 2025, and June 30, 2024, respectively. | ||||||||||||
| (b) Includes $210, $233, and $223 of 100% U.S. Treasury Money Market Fund AUM at June 30, 2025, | ||||||||||||
| March 31, 2025, and June 30, 2024, respectively. | ||||||||||||
Assets under management on June 30, 2025 were $33.4 billion, an increase of 7.1% from the $31.2 billion on March 31, 2025. The quarter’s increase consisted of net market appreciation of $2.0 billion and the addition of the Keeley assets of $1.0 billion partially offset by net outflows of $0.6 billion and distributions, net of reinvestments, of $0.1 billion.
Mutual Funds
Assets under management in Mutual Funds on June 30, 2025 were $8.8 billion, an increase of 10.0% from the $8.0 billion at March 31, 2025. The quarterly change was attributed to:
- Addition of 4 new funds of $440 million from Keeley transaction;
- Distributions, net of reinvestment, of $4 million;
- Net outflows of $198 million; and
- Net market appreciation of $620 million.
Closed-end Funds
Assets under management in Closed-end Funds on June 30, 2025 were $7.6 billion, an increase of 2.7% from the $7.4 billion on March 31, 2025. The quarterly change was comprised of:
- Distributions, net of reinvestment, of $145 million;
- Net outflows of $38 million, including the redemption of $38 million of preferred shares, and the repurchase of $20 million of common stock partially offset by the issuance of $12 million common stock and the issuance of $8 million preferred shares; and
- Net market appreciation of $445 million.
Institutional & PWM
Assets under management in Institutional & PWM on June 30, 2025 were $11.4 billion, an increase of 11.8% from the $10.2 billion on March 31, 2025. The quarterly change was due to:
- Addition of approximately 500 accounts of $578 million from Keeley transaction;
- Net outflows of $224 million; and
- Net market appreciation of $838 million.
SICAV
Assets under management were $9 million in the GAMCO All Cap Value sleeve and the GAMCO Convertible Securities sleeve on June 30, 2025, unchanged from $9 million at March 31, 2025.
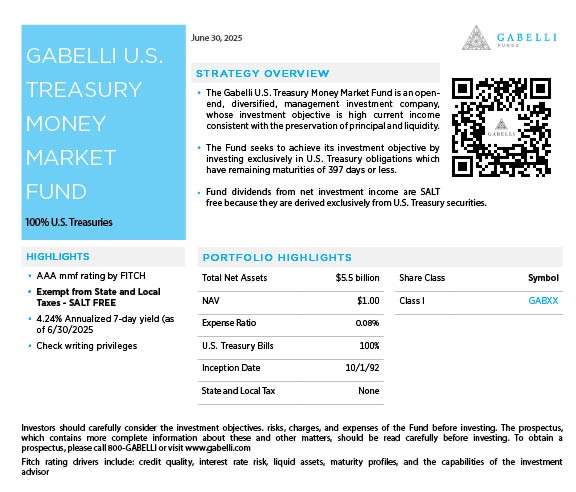
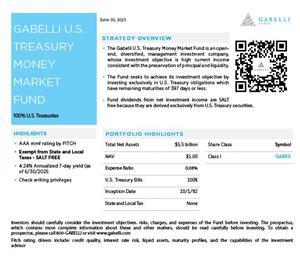
100% U.S. Treasury Money Market Fund
Assets under management in our 100% U.S. Treasury Money Market Fund (GABXX) on June 30, 2025 were $5.5 billion, almost unchanged from the $5.6 billion at March 31, 2025.
The Gabelli Commercial Aerospace & Defense (GCAD) ETF – Up 22.7% For 2nd quarter of 2025
Portfolio manager Tony Bancroft commented on several factors that impacted The Gabelli Commercial Aerospace & Defense (GCAD) ETF’s 2nd quarter 2025 performance:
- Sector Resilience Amid Tariff Pressures: The aerospace and defense sector maintained stability in Q2 2025, buoyed by a strong U.S. manufacturing base and consistent DoD demand, despite President Trump’s tariff policies creating modest cost pressures on imported materials like rare metals and electronics.
- Defense Budget Stability: The FY2026 defense budget of $893 billion, including $848 billion for the Pentagon, supports key holdings like Lockheed Martin and RTX, with increased investments in high-tech missiles, drones, and Indo-Pacific deterrence ensuring steady revenue streams.
- Commercial Aerospace Recovery: Robust air travel demand drove orders for fuel-efficient aircraft, benefiting Boeing, though its global supply chain faced minor tariff-related cost increases, partially offset by strong DoD contracts.
- Supply Chain and Cost Challenges: Tariff-driven risks, including potential supply chain disruptions and higher costs for specialized components, posed manageable near-term hurdles but could impact margins if trade tensions escalate.
- Long-Term Growth Outlook: Geopolitical tensions, military modernization, and sustained commercial aerospace demand, particularly in Asia and Africa, position the sector for multi-year growth, with GCAD’s holdings well-placed to capitalize on innovation and government-backed contracts.
Assets Under Administration
| (In millions) | As of | |||||||||||
| June 30, 2025 | March 31, 2025 | June 30, 2024 | ||||||||||
| Teton Advisors, Inc. (a) | $ | 287 | $ | 750 | $ | 880 | ||||||
| SICAV | 455 | 401 | 468 | |||||||||
| Total Assets Under Administration | $ | 742 | $ | 1,151 | $ | 1,348 | ||||||
| (a) Includes $211, $206 and $297 of subadvised AUM for Teton Advisors, Inc. at | ||||||||||||
| June 30, 2025, March 31, 2025 and June 30, 2024, respectively. | ||||||||||||
AUA on June 30, 2025 were $0.7 billion, a decrease of $0.5 billion, or 41.7%, from the $1.2 billion at March 31, 2025. The second quarter’s decrease includes the reclassification of Teton-Keeley Funds from AUA to AUM due to the partnership with Keeley for the management contracts of 4 open-end funds, that were previously administered by Gabelli.
Return to Shareholders
During the second quarter of 2025, Gabelli returned $3.5 million to shareholders in the form of the repurchase of 73,781 shares for $1.7 million at an average investment of $23.00 per share and a regular quarterly dividend of $0.08 per share totaling $1.8 million. At June 30, 2025, the total shares available under the Stock Repurchase Program to be repurchased in the future were 939,480. From July 1, 2025 to August 5, 2025, the Company has repurchased 53,720 shares at an average price of $24.02 per share for an aggregate purchase price of approximately $1.3 million.
On August 5, 2025, Gabelli’s board of directors declared a regular quarterly dividend of $0.08 per share, which is payable on September 30, 2025 to class A and class B shareholders of record on September 16, 2025.
Balance Sheet Information
As of June 30, 2025, cash, cash equivalents, see capital, and investments were $182.8 million, compared with $182.8 million as of December 31, 2024. As of June 30, 2025, stockholders’ equity was $152.4 million compared to $137.3 million as of December 31, 2024. The increase in stockholders’ equity resulted from $30.1 million in net income offset partially by the payment of $6.6 for the acquisition of Gabelli-Keeley AUM, $14.0 million of stock buybacks, and $3.6 million in dividends.
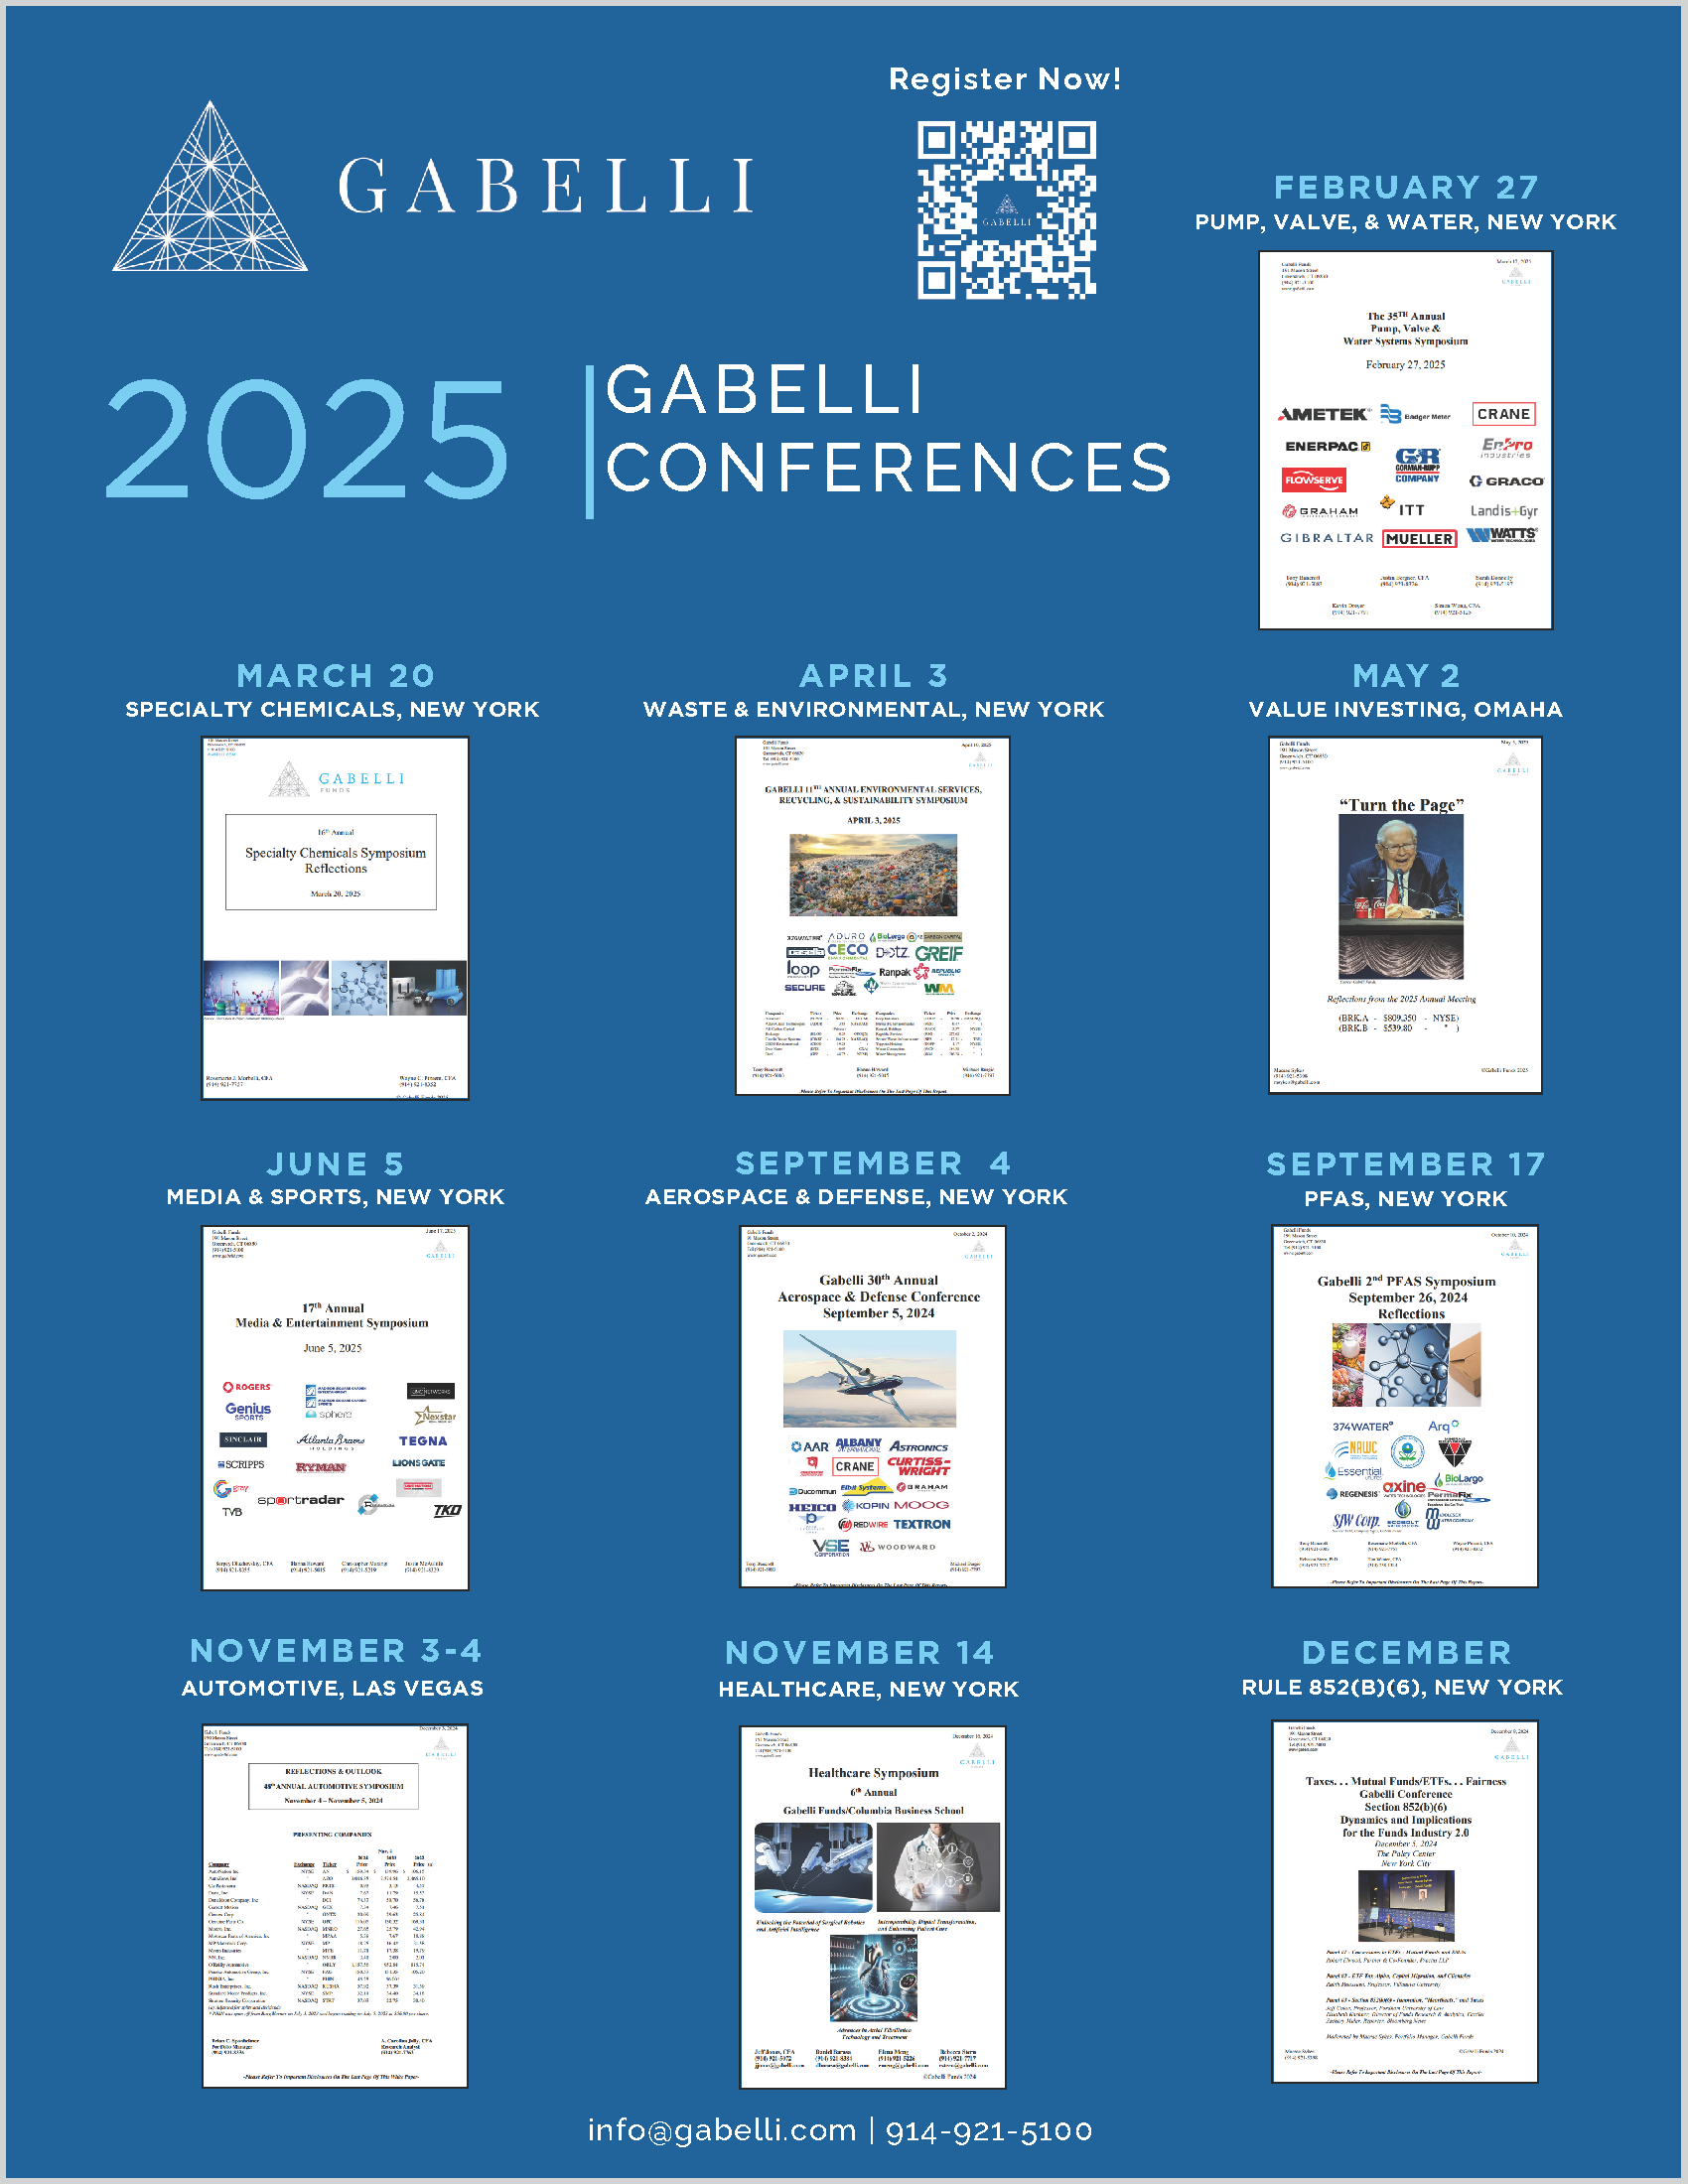
Symposiums/Conferences
- On April 3rd, we hosted the 11th Annual Waste & Environmental Services Symposium. The conference featured presentations by senior management of several leading companies, with a focus on the themes of waste, water treatment, and the environment.
- On May 2nd, GAMCO hosted its 16th annual Omaha Research Trip in conjunction with the Berkshire Hathaway Annual Meeting. This Value Investor Conference attracted a record number of participants with Gabelli portfolio managers anchoring panels with noted Berkshire experts and regional CEOs.
- On May 15th and 16th, we hosted our 40th GAMCO client meeting in New York City. We presented our annual Gabelli Prize in honor of Graham & Dodd, Murray, and Greenwald for Value Investing to Jennifer A. Wallace, the founding partner of Summit Street Capital Management, LLC. We also inducted four new members to the GAMCO Management Hall of Fame: Ian Walsh of Kaman Corporation; Kenichiro Yoshida of Sony Corporation; Bob Lyons of GATX Corporation; and, Luca Savi of ITT Inc.
- On June 5th, we hosted the 17th Annual Media & Entertainment Symposium highlighted by a sports investing panel.
- At the June 25th and 26th Morningstar Conference, Gabelli Funds was a Principal Sponsor at Navy Pier in Chicago featuring keynote presentations by Tony Bancroft, portfolio manager of the Gabelli Aerospace & Defense ETF; Mac Sykes, portfolio manager of the Gabelli Financial Services Opportunities ETF, and John Belton, portfolio manager of the Gabelli Growth Innovators ETF.
We are hosting the following symposiums and conferences in 2025:
About Gabelli
Gabelli (OTCQX: GAMI), established in 1977, is a widely-recognized provider of investment advisory services to 27 open-end funds, 13 United States closed-end funds and one United Kingdom investment company, 5 actively managed exchange traded funds, one société d’investissement à capital variable, and approximately 1,900 institutional and private wealth management investors principally in the U.S. The Company’s revenues are based primarily on the levels of assets under management and fees associated with the various investment products.
In 1977, Gabelli launched its well-known All Cap Value equity strategy, Gabelli Value, in a separate account format and in 1986 entered the mutual fund business. Today, Gabelli offers a diverse set of client solutions across asset classes (e.g. Equities, Debt Instruments, Convertibles, non-market correlated Merger Arbitrage), regions, market capitalizations, sectors (e.g. Gold, Utilities) and investment styles (e.g. Value, Growth). Gabelli serves a broad client base, including institutions, intermediaries, offshore investors, private wealth, and direct retail investors.
CAUTIONARY STATEMENT REGARDING FORWARD-LOOKING STATEMENTS
Our disclosure and analysis in this press release, which do not present historical information, contain “forward-looking statements” within the meaning of the U.S. Private Securities Litigation Reform Act of 1995. Forward-looking statements convey our current expectations or forecasts of future events. You can identify these statements because they do not relate strictly to historical or current facts. They use words such as “anticipate,” “estimate,” “expect,” “project,” “intend,” “plan,” “believe,” and other words and terms of similar meaning. They also appear in any discussion of future operating or financial performance. In particular, these include statements relating to future actions, future performance of our products, expenses, the outcome of any legal proceedings, and financial results. Although we believe that we are basing our expectations and beliefs on reasonable assumptions within the bounds of what we currently know about our business and operations, the economy, and other conditions, there can be no assurance that our actual results will not differ materially from what we expect or believe. Therefore, you should proceed with caution in relying on any of these forward-looking statements. They are neither statements of historical fact nor guarantees or assurances of future performance.
Forward-looking statements involve a number of known and unknown risks, uncertainties and other important factors, some of which are listed below, that are difficult to predict and could cause actual results and outcomes to differ materially from any future results or outcomes expressed or implied by such forward-looking statements. Some of the factors that may cause our actual results to differ from our expectations include risks associated with the duration and scope of the ongoing coronavirus pandemic resulting in volatile market conditions, a decline in the securities markets that adversely affect our assets under management, negative performance of our products, the failure to perform as required under our investment management agreements, and a general downturn in the economy that negatively impacts our operations. We also direct your attention to the more specific discussions of these and other risks, uncertainties and other important factors contained in our Annual Report and other public filings. Other factors that could cause our actual results to differ may emerge from time to time, and it is not possible for us to predict all of them. We do not undertake to update publicly any forward-looking statements if we subsequently learn that we are unlikely to achieve our expectations whether as a result of new information, future developments or otherwise, except as may be required by law.
Gabelli Funds, LLC is a registered investment adviser with the Securities and Exchange Commission and is a wholly owned subsidiary of GAMCO Investors, Inc. (OTCQX: GAMI).
Investors should carefully consider the investment objectives, risks, charges and expenses of the fund before investing. The prospectus, which contains more complete information about this and other matters, should be read carefully before investing. To obtain a prospectus, please call 800 GABELLI or visit www.gabelli.com
Fitch rating drivers include: credit quality, interest rate risk, liquid assets, maturity profiles, and the capabilities of the investment advisor
Money Market Fund
Investment in the fund is neither guaranteed nor insured by the Federal Deposit Insurance Corporation or any government agency. Although the fund seeks to preserve the value of your investment at $1.00 per share, it cannot guarantee it will do so. The fund’s sponsor has no legal obligation to provide financial support to the fund, and you should not expect that the sponsor will provide financial support to the fund at any time. You could lose money by investing in the fund.
Active Exchange-Traded Funds
GABELLI COMMERCIAL AEROSPACE & DEFENSE: GCAD
IMPORTANT DISCLOSURES
These ETFs are different from traditional ETFs. Traditional ETFs tell the public what assets they hold each day. These ETFs do not. This may create additional risks for your investment. For example:
- You may have to pay more money to trade the ETFs’ shares. These ETFs will provide less information to traders, who tend to charge more for trades when they have less information.
- The price you pay to buy ETF shares on an exchange may not match the value of an ETF’s portfolio. The same is true when you sell shares. These price differences may be greater for these ETFs compared to other ETFs because they provide less information to traders.
- These additional risks may be even greater in challenging or uncertain market conditions.
- The differences between these ETFs and other ETFs may also have advantages. By keeping certain information about the ETFs undisclosed, these ETFs may face less risk that other traders can predict or copy its investment strategy. This may improve the ETFs’ performance. If other traders are able to copy or predict the ETFs’ investment strategies, however, this may hurt the ETFs’ performance. For additional information regarding the unique attributes and risks of these ETFs, see the ActiveShares prospectus/registration statement.
You should consider the ETFs’ investment objectives, risks, charges and expenses carefully before you invest. The ETFs’ Prospectus is available from G.distributors, LLC, a registered broker-dealer and FINRA member firm, and contains this and other information about the ETFs, and should be read carefully before investing.
GCAD
Government aerospace regulation and spending policies can significantly affect the aerospace industry because many companies involved in the aerospace industry rely to a large extent on U.S. (and other) Government demand for their products and services.
Returns represent past performance and do not guarantee future results. Investment returns and the principal value of an investment will fluctuate. When shares are redeemed, they may be worth more or less than their original cost. Current performance may be lower or higher than the performance data presented. Visit www.gabelli.com for performance information as of the most recent month end.
| GAMCO Investors, Inc. and Subsidiaries | ||||||||||||
| Condensed Consolidated Statements of Operations (Unaudited) | ||||||||||||
| (in thousands, except per share data) | ||||||||||||
| Three Months Ended | ||||||||||||
| June 30, 2025 | March 31, 2025 | June 30, 2024 | ||||||||||
| Revenue: | ||||||||||||
| Investment advisory and incentive fees | $ | 55,445 | $ | 53,786 | $ | 53,290 | ||||||
| Distribution fees and other income | 3,579 | 3,542 | 4,354 | |||||||||
| Total revenue | 59,024 | 57,328 | 57,644 | |||||||||
| Expenses: | ||||||||||||
| Compensation | 25,035 | 26,616 | 29,006 | |||||||||
| Management fee | 2,785 | 2,202 | 2,021 | |||||||||
| Distribution costs | 5,319 | 5,138 | 5,709 | |||||||||
| Other operating expenses | 6,715 | 4,779 | 5,258 | |||||||||
| Total expenses | 39,854 | 38,735 | 41,994 | |||||||||
| Operating income | 19,170 | 18,593 | 15,650 | |||||||||
| Non-operating income: | ||||||||||||
| Gain/(loss) from investments, net | 4,567 | (110 | ) | 99 | ||||||||
| Interest and dividend income | 1,615 | 1,622 | 2,726 | |||||||||
| Interest expense | (310 | ) | (292 | ) | (290 | ) | ||||||
| Total non-operating income | 5,872 | 1,220 | 2,535 | |||||||||
| Income before provision for income taxes | 25,042 | 19,813 | 18,185 | |||||||||
| Provision for income taxes | 4,211 | 1,542 | 3,168 | |||||||||
| Net income | $ | 20,831 | $ | 18,271 | $ | 15,017 | ||||||
| Earnings per share attributable to common | ||||||||||||
| stockholders: | ||||||||||||
| Basic | $ | 0.93 | $ | 0.81 | $ | 0.61 | ||||||
| Diluted | $ | 0.93 | $ | 0.81 | $ | 0.61 | ||||||
| Weighted average shares outstanding: | ||||||||||||
| Basic | 22,399 | 22,632 | 24,442 | |||||||||
| Diluted | 22,399 | 22,632 | 24,442 | |||||||||
| Shares outstanding | 22,357 | 22,431 | 24,335 | |||||||||
| GAMCO Investors, Inc. and Subsidiaries | ||||||||||||
| Condensed Consolidated Statements of Financial Condition (Unaudited) | ||||||||||||
| (in thousands) | ||||||||||||
| June 30, | December 31, | June 30, | ||||||||||
| 2025 | 2024 | 2024 | ||||||||||
| Assets | ||||||||||||
| Cash and cash equivalents | $ | 57,088 | $ | 17,254 | $ | 76,093 | ||||||
| Short-term investments in U.S. Treasury Bills | 49,401 | 99,216 | 99,061 | |||||||||
| Investments in securities | 44,261 | 36,855 | 30,606 | |||||||||
| Seed capital investments | 32,093 | 29,452 | 26,475 | |||||||||
| Receivable from brokers | 6,595 | 3,103 | 3,244 | |||||||||
| Other receivables | 21,241 | 21,246 | 19,009 | |||||||||
| Deferred tax asset and income tax receivable | 10,252 | 8,042 | 8,822 | |||||||||
| Other assets | 14,432 | 9,509 | 10,546 | |||||||||
| Total assets | $ | 235,363 | $ | 224,677 | $ | 273,856 | ||||||
| Liabilities and stockholders' equity | ||||||||||||
| Income taxes payable | $ | 1,504 | $ | 193 | $ | 120 | ||||||
| Compensation payable | 36,628 | 40,633 | 36,395 | |||||||||
| Accrued expenses and other liabilities | 44,856 | 46,546 | 44,912 | |||||||||
| Total liabilities | 82,988 | 87,372 | 81,427 | |||||||||
| Stockholders' equity | 152,375 | 137,305 | 192,429 | |||||||||
| Total liabilities and stockholders' equity | $ | 235,363 | $ | 224,677 | $ | 273,856 | ||||||
| GAMCO Investors, Inc. and Subsidiaries | ||||||||||||||||||
| Assets Under Management | ||||||||||||||||||
| By investment vehicle | ||||||||||||||||||
| (in millions) | ||||||||||||||||||
| Three Months Ended | % Changed From | |||||||||||||||||
| June 30, | March 31, | June 30, | March 31, | June 30, | ||||||||||||||
| 2025 | 2025 | 2024 | 2025 | 2024 | ||||||||||||||
| Equities: | ||||||||||||||||||
| Mutual Funds | ||||||||||||||||||
| Beginning of period assets | $ | 7,959 | $ | 8,078 | $ | 8,235 | ||||||||||||
| Inflows | 665 | 190 | 189 | |||||||||||||||
| Outflows | (423 | ) | (389 | ) | (359 | ) | ||||||||||||
| Net inflows (outflows) | 242 | (199 | ) | (170 | ) | |||||||||||||
| Market appreciation (depreciation) | 620 | 84 | (26 | ) | ||||||||||||||
| Fund distributions, net of reinvestment | (4 | ) | (4 | ) | (4 | ) | ||||||||||||
| Total increase (decrease) | 858 | (119 | ) | (200 | ) | |||||||||||||
| Assets under management, end of period | $ | 8,817 | $ | 7,959 | $ | 8,035 | 10.8 | % | 9.7 | % | ||||||||
| Percentage of total assets under management | 26.4 | % | 25.5 | % | 26.2 | % | ||||||||||||
| Average assets under management | $ | 8,259 | $ | 8,176 | $ | 8,095 | 1.0 | % | 2.0 | % | ||||||||
| Closed-end Funds | ||||||||||||||||||
| Beginning of period assets | $ | 7,365 | $ | 7,344 | $ | 7,313 | ||||||||||||
| Inflows | 19 | 8 | 3 | |||||||||||||||
| Outflows | (57 | ) | (48 | ) | (48 | ) | ||||||||||||
| Net inflows (outflows) | (38 | ) | (40 | ) | (45 | ) | ||||||||||||
| Market appreciation (depreciation) | 445 | 199 | (89 | ) | ||||||||||||||
| Fund distributions, net of reinvestment | (145 | ) | (138 | ) | (127 | ) | ||||||||||||
| Total increase (decrease) | 262 | 21 | (261 | ) | ||||||||||||||
| Assets under management, end of period | 7,627 | $ | 7,365 | $ | 7,052 | 3.6 | % | 8.2 | % | |||||||||
| Percentage of total assets under management | 22.9 | % | 23.6 | % | 23.0 | % | ||||||||||||
| Average assets under management | $ | 7,364 | $ | 7,505 | $ | 7,166 | -1.9 | % | 2.8 | % | ||||||||
| Institutional & PWM | ||||||||||||||||||
| Beginning of period assets | $ | 10,182 | $ | 10,700 | $ | 11,146 | ||||||||||||
| Inflows | 729 | 120 | 125 | |||||||||||||||
| Outflows | (375 | ) | (601 | ) | (493 | ) | ||||||||||||
| Net inflows (outflows) | 354 | (481 | ) | (368 | ) | |||||||||||||
| Market appreciation (depreciation) | 838 | (37 | ) | (342 | ) | |||||||||||||
| Total increase (decrease) | 1,192 | (518 | ) | (710 | ) | |||||||||||||
| Assets under management, end of period | $ | 11,374 | $ | 10,182 | $ | 10,436 | 11.7 | % | 9.0 | % | ||||||||
| Percentage of total assets under management | 34.1 | % | 32.7 | % | 34.0 | % | ||||||||||||
| Average assets under management | $ | 10,941 | $ | 10,772 | $ | 10,775 | 1.6 | % | 1.5 | % | ||||||||
| SICAV | ||||||||||||||||||
| Beginning of period assets | $ | 9 | $ | 9 | $ | 9 | ||||||||||||
| Inflows | - | - | - | |||||||||||||||
| Outflows | - | - | - | |||||||||||||||
| Net inflows (outflows) | - | - | - | |||||||||||||||
| Market appreciation (depreciation) | - | - | - | |||||||||||||||
| Reclassification to AUA | - | - | - | |||||||||||||||
| Total increase (decrease) | - | - | - | |||||||||||||||
| Assets under management, end of period | $ | 9 | $ | 9 | $ | 9 | 0.0 | % | 0.0 | % | ||||||||
| Percentage of total assets under management | 0.0 | % | 0.0 | % | 0.0 | % | ||||||||||||
| Average assets under management | $ | 9 | $ | 9 | $ | 9 | 0.0 | % | 0.0 | % | ||||||||
| Total Equities | ||||||||||||||||||
| Beginning of period assets | $ | 25,515 | $ | 26,131 | $ | 26,703 | ||||||||||||
| Inflows | 1,413 | 318 | 317 | |||||||||||||||
| Outflows | (855 | ) | (1,038 | ) | (900 | ) | ||||||||||||
| Net inflows (outflows) | 558 | (720 | ) | (583 | ) | |||||||||||||
| Market appreciation (depreciation) | 1,903 | 246 | (457 | ) | ||||||||||||||
| Fund distributions, net of reinvestment | (149 | ) | (142 | ) | (131 | ) | ||||||||||||
| Reclassification to AUA | - | - | - | |||||||||||||||
| Total increase (decrease) | 2,312 | (616 | ) | (1,171 | ) | |||||||||||||
| Assets under management, end of period | $ | 27,827 | $ | 25,515 | $ | 25,532 | 9.1 | % | 9.0 | % | ||||||||
| Percentage of total assets under management | 83.4 | % | 81.8 | % | 83.1 | % | ||||||||||||
| Average assets under management | $ | 26,573 | $ | 26,462 | $ | 26,045 | 0.4 | % | 2.0 | % | ||||||||
| GAMCO Investors, Inc. and Subsidiaries | ||||||||||||||||||
| Assets Under Management | ||||||||||||||||||
| By investment vehicle - continued | ||||||||||||||||||
| (in millions) | ||||||||||||||||||
| Three Months Ended | % Changed From | |||||||||||||||||
| June 30, | March 31, | June 30, | March 31, | June 30, | ||||||||||||||
| 2025 | 2025 | 2024 | 2025 | 2024 | ||||||||||||||
| Fixed Income: | ||||||||||||||||||
| 100% U.S. Treasury fund | ||||||||||||||||||
| Beginning of period assets | $ | 5,638 | $ | 5,552 | $ | 4,965 | ||||||||||||
| Inflows | 1,243 | 1,372 | 1,290 | |||||||||||||||
| Outflows | (1,442 | ) | (1,341 | ) | (1,162 | ) | ||||||||||||
| Net inflows (outflows) | (199 | ) | 31 | 128 | ||||||||||||||
| Market appreciation (depreciation) | 59 | 55 | 66 | |||||||||||||||
| Total increase (decrease) | (140 | ) | 86 | 194 | ||||||||||||||
| Assets under management, end of period | $ | 5,498 | $ | 5,638 | $ | 5,159 | -2.5 | % | 6.6 | % | ||||||||
| Percentage of total assets under management | 16.5 | % | 18.1 | % | 16.8 | % | ||||||||||||
| Average assets under management | $ | 5,561 | $ | 5,552 | $ | 5,064 | 0.2 | % | 9.8 | % | ||||||||
| Institutional & PWM Fixed Income | ||||||||||||||||||
| Beginning of period assets | $ | 32 | $ | 32 | $ | 32 | ||||||||||||
| Inflows | - | - | - | |||||||||||||||
| Outflows | - | - | - | |||||||||||||||
| Net inflows (outflows) | - | - | - | |||||||||||||||
| Market appreciation (depreciation) | - | - | - | |||||||||||||||
| Total increase (decrease) | - | - | - | |||||||||||||||
| Assets under management, end of period | $ | 32 | $ | 32 | $ | 32 | 0.0 | % | 0.0 | % | ||||||||
| Percentage of total assets under management | 0.1 | % | 0.1 | % | 0.1 | % | ||||||||||||
| Average assets under management | $ | 32 | $ | 32 | $ | 32 | 0.0 | % | 0.0 | % | ||||||||
| Total Treasuries & Fixed Income | ||||||||||||||||||
| Beginning of period assets | $ | 5,670 | $ | 5,584 | $ | 4,997 | ||||||||||||
| Inflows | 1,243 | 1,372 | 1,290 | |||||||||||||||
| Outflows | (1,442 | ) | (1,341 | ) | (1,162 | ) | ||||||||||||
| Net inflows (outflows) | (199 | ) | 31 | 128 | ||||||||||||||
| Market appreciation (depreciation) | 59 | 55 | 66 | |||||||||||||||
| Total increase (decrease) | (140 | ) | 86 | 194 | ||||||||||||||
| Assets under management, end of period | $ | 5,530 | $ | 5,670 | $ | 5,191 | -2.5 | % | 6.5 | % | ||||||||
| Percentage of total assets under management | 16.6 | % | 18.2 | % | 16.9 | % | ||||||||||||
| Average assets under management | $ | 5,593 | $ | 5,584 | $ | 5,096 | 0.2 | % | 9.8 | % | ||||||||
| Total AUM | ||||||||||||||||||
| Beginning of period assets | $ | 31,185 | $ | 31,715 | $ | 31,700 | ||||||||||||
| Inflows | 2,656 | 1,690 | 1,607 | |||||||||||||||
| Outflows | (2,297 | ) | (2,379 | ) | (2,062 | ) | ||||||||||||
| Net inflows (outflows) | 359 | (689 | ) | (455 | ) | |||||||||||||
| Market appreciation (depreciation) | 1,962 | 301 | (391 | ) | ||||||||||||||
| Fund distributions, net of reinvestment | (149 | ) | (142 | ) | (131 | ) | ||||||||||||
| Reclassification to AUA | - | - | - | |||||||||||||||
| Total increase (decrease) | 2,172 | (530 | ) | (977 | ) | |||||||||||||
| Assets under management, end of period | $ | 33,357 | $ | 31,185 | $ | 30,723 | 7.0 | % | 8.6 | % | ||||||||
| Average assets under management | $ | 32,166 | $ | 32,046 | $ | 31,141 | 0.4 | % | 3.3 | % | ||||||||
| GAMCO Investors, Inc. and Subsidiaries | |||||||||||
| Assets Under Management | |||||||||||
| By investment vehicle | |||||||||||
| (in millions) | |||||||||||
| Six Months Ended | |||||||||||
| June 30, | June 30, | ||||||||||
| 2025 | 2024 | % Change | |||||||||
| Equities: | |||||||||||
| Mutual Funds | |||||||||||
| Beginning of period assets | $ | 8,078 | $ | 7,973 | |||||||
| Inflows | 855 | 365 | |||||||||
| Outflows | (812 | ) | (791 | ) | |||||||
| Net inflows (outflows) | 43 | (426 | ) | ||||||||
| Market appreciation (depreciation) | 704 | 497 | |||||||||
| Fund distributions, net of reinvestment | (8 | ) | (9 | ) | |||||||
| Total increase (decrease) | 739 | 62 | |||||||||
| Assets under management, end of period | $ | 8,817 | $ | 8,035 | 9.7 | % | |||||
| Percentage of total assets under management | 26.4 | % | 26.2 | % | |||||||
| Average assets under management | $ | 8,061 | $ | 8,030 | 0.4 | % | |||||
| Closed-end Funds | |||||||||||
| Beginning of period assets | $ | 7,344 | $ | 7,097 | |||||||
| Inflows | 27 | 44 | |||||||||
| Outflows | (105 | ) | (151 | ) | |||||||
| Net inflows (outflows) | (78 | ) | (107 | ) | |||||||
| Market appreciation (depreciation) | 644 | 315 | |||||||||
| Fund distributions, net of reinvestment | (283 | ) | (253 | ) | |||||||
| Total increase (decrease) | 283 | (45 | ) | ||||||||
| Assets under management, end of period | $ | 7,627 | $ | 7,052 | 8.2 | % | |||||
| Percentage of total assets under management | 22.9 | % | 23.0 | % | |||||||
| Average assets under management | $ | 7,434 | $ | 7,113 | 4.5 | % | |||||
| Institutional & PWM | |||||||||||
| Beginning of period assets | $ | 10,700 | $ | 10,738 | |||||||
| Inflows | 849 | 191 | |||||||||
| Outflows | (976 | ) | (921 | ) | |||||||
| Net inflows (outflows) | (127 | ) | (730 | ) | |||||||
| Market appreciation (depreciation) | 801 | 428 | |||||||||
| Total increase (decrease) | 674 | (302 | ) | ||||||||
| Assets under management, end of period | $ | 11,374 | $ | 10,436 | 9.0 | % | |||||
| Percentage of total assets under management | 34.1 | % | 34.0 | % | |||||||
| Average assets under management | $ | 11,014 | $ | 10,787 | 2.1 | % | |||||
| SICAV | |||||||||||
| Beginning of period assets | $ | 9 | $ | 631 | |||||||
| Inflows | - | - | |||||||||
| Outflows | - | (2 | ) | ||||||||
| Net inflows (outflows) | - | (2 | ) | ||||||||
| Market appreciation (depreciation) | - | - | |||||||||
| Reclassification to AUA | - | (620 | ) | ||||||||
| Total increase (decrease) | - | (622 | ) | ||||||||
| Assets under management, end of period | $ | 9 | $ | 9 | 0.0 | % | |||||
| Percentage of total assets under management | 0.0 | % | 0.0 | % | |||||||
| Average assets under management | $ | 9 | $ | 9 | 0.0 | % | |||||
| Total Equities | |||||||||||
| Beginning of period assets | $ | 26,131 | $ | 26,439 | |||||||
| Inflows | 1,731 | 600 | |||||||||
| Outflows | (1,893 | ) | (1,865 | ) | |||||||
| Net inflows (outflows) | (162 | ) | (1,265 | ) | |||||||
| Market appreciation (depreciation) | 2,149 | 1,240 | |||||||||
| Fund distributions, net of reinvestment | (291 | ) | (262 | ) | |||||||
| Reclassification to AUA | - | (620 | ) | ||||||||
| Total increase (decrease) | 1,696 | (907 | ) | ||||||||
| Assets under management, end of period | $ | 27,827 | $ | 25,532 | 9.0 | % | |||||
| Percentage of total assets under management | 83.4 | % | 83.1 | % | |||||||
| Average assets under management | $ | 26,518 | $ | 25,939 | 2.2 | % | |||||
| GAMCO Investors, Inc. and Subsidiaries | |||||||||||
| Assets Under Management | |||||||||||
| By investment vehicle - continued | |||||||||||
| (in millions) | |||||||||||
| Six Months Ended | |||||||||||
| June 30, | June 30, | ||||||||||
| 2025 | 2024 | % Change | |||||||||
| Fixed Income: | |||||||||||
| 100% U.S. Treasury fund | |||||||||||
| Beginning of period assets | $ | 5,552 | $ | 4,615 | |||||||
| Inflows | 2,615 | 2,895 | |||||||||
| Outflows | (2,783 | ) | (2,477 | ) | |||||||
| Net inflows (outflows) | (168 | ) | 418 | ||||||||
| Market appreciation (depreciation) | 114 | 126 | |||||||||
| Total increase (decrease) | (54 | ) | 544 | ||||||||
| Assets under management, end of period | $ | 5,498 | $ | 5,159 | 6.6 | % | |||||
| Percentage of total assets under management | 16.5 | % | 16.8 | % | |||||||
| Average assets under management | $ | 5,556 | $ | 4,948 | 12.3 | % | |||||
| Institutional & PWM Fixed Income | |||||||||||
| Beginning of period assets | $ | 32 | $ | 32 | |||||||
| Inflows | - | - | |||||||||
| Outflows | - | - | |||||||||
| Net inflows (outflows) | - | - | |||||||||
| Market appreciation (depreciation) | - | - | |||||||||
| Total increase (decrease) | - | - | |||||||||
| Assets under management, end of period | $ | 32 | $ | 32 | 0.0 | % | |||||
| Percentage of total assets under management | 0.1 | % | 0.1 | % | |||||||
| Average assets under management | $ | 32 | $ | 32 | 0.0 | % | |||||
| Total Treasuries & Fixed Income | |||||||||||
| Beginning of period assets | $ | 5,584 | $ | 4,647 | |||||||
| Inflows | 2,615 | 2,895 | |||||||||
| Outflows | (2,783 | ) | (2,477 | ) | |||||||
| Net inflows (outflows) | (168 | ) | 418 | ||||||||
| Market appreciation (depreciation) | 114 | 126 | |||||||||
| Total increase (decrease) | (54 | ) | 544 | ||||||||
| Assets under management, end of period | $ | 5,530 | $ | 5,191 | 6.5 | % | |||||
| Percentage of total assets under management | 16.6 | % | 16.9 | % | |||||||
| Average assets under management | $ | 5,588 | $ | 4,980 | 12.2 | % | |||||
| Total AUM | |||||||||||
| Beginning of period assets | $ | 31,715 | $ | 31,086 | |||||||
| Inflows | 4,346 | 3,495 | |||||||||
| Outflows | (4,676 | ) | (4,342 | ) | |||||||
| Net inflows (outflows) | (330 | ) | (847 | ) | |||||||
| Market appreciation (depreciation) | 2,263 | 1,366 | |||||||||
| Fund distributions, net of reinvestment | (291 | ) | (262 | ) | |||||||
| Reclassification to AUA | - | (620 | ) | ||||||||
| Total increase (decrease) | 1,642 | (363 | ) | ||||||||
| Assets under management, end of period | $ | 33,357 | $ | 30,723 | 8.6 | % | |||||
| Average assets under management | $ | 32,106 | $ | 30,919 | 3.8 | % | |||||
| Contact: | Kieran Caterina |
| Chief Accounting Officer |
|
| (914) 921-5149 | |
| For further information please visit | |
| www.gabelli.com | |
Photos accompanying this announcement are available at:
https://www.globenewswire.com/NewsRoom/AttachmentNg/781b1a77-e42d-417d-83a0-3d3192bf1723
https://www.globenewswire.com/NewsRoom/AttachmentNg/4630c455-8c98-41be-917b-5cff58731326

![]()
GUSTO half pager
GUSTO Fund fact sheet
2025 Conferences

2025 Conferences
Legal Disclaimer:
EIN Presswire provides this news content "as is" without warranty of any kind. We do not accept any responsibility or liability for the accuracy, content, images, videos, licenses, completeness, legality, or reliability of the information contained in this article. If you have any complaints or copyright issues related to this article, kindly contact the author above.
